After an average of six months of analytics reporting and strategic implementation of recommendations, our clients saw…
increase in engagement
increase on impressions
follower increase
Rock Paper Scissors’ custom Looker Studio dashboards turn scattered social data into one clear, real-time view of performance, paired with monthly expert insights from our team that transform metrics to strategy. Clients not only see what’s working, but why it’s working, allowing them to gain clarity, confidence and measurable growth across platforms.
Our clients had access to more data than ever, but no clear way to use it. Social metrics lived across multiple platforms, making reporting manual, time-consuming and inconsistent.
Without a centralized view, data felt disconnected from strategy. Clients struggled to understand what was actually driving results, compare performance month over month or make confident decisions based on what they were seeing.
Clients didn’t just need better reports; they needed clarity. That’s where Rock Paper Scissors’ custom Looker Studio dashboards come in.
We build fully customized, real-time dashboards that centralize data from multiple digital platforms into their own clear, visual source. No more confusing spreadsheets. No more guesswork.
Paired with monthly analysis and strategic recommendations from our team, these dashboards turn metrics into meaning. Each board is tailored to the client’s goals, highlighting the platforms, KPIs and trends that matter most—so every decision is backed by insight, not assumption.
This isn’t just reporting. It’s ongoing strategy, accountability and optimization powered by data.
With consistent, long-term reporting and strategic guidance, our clients are seeing measurable, meaningful growth.
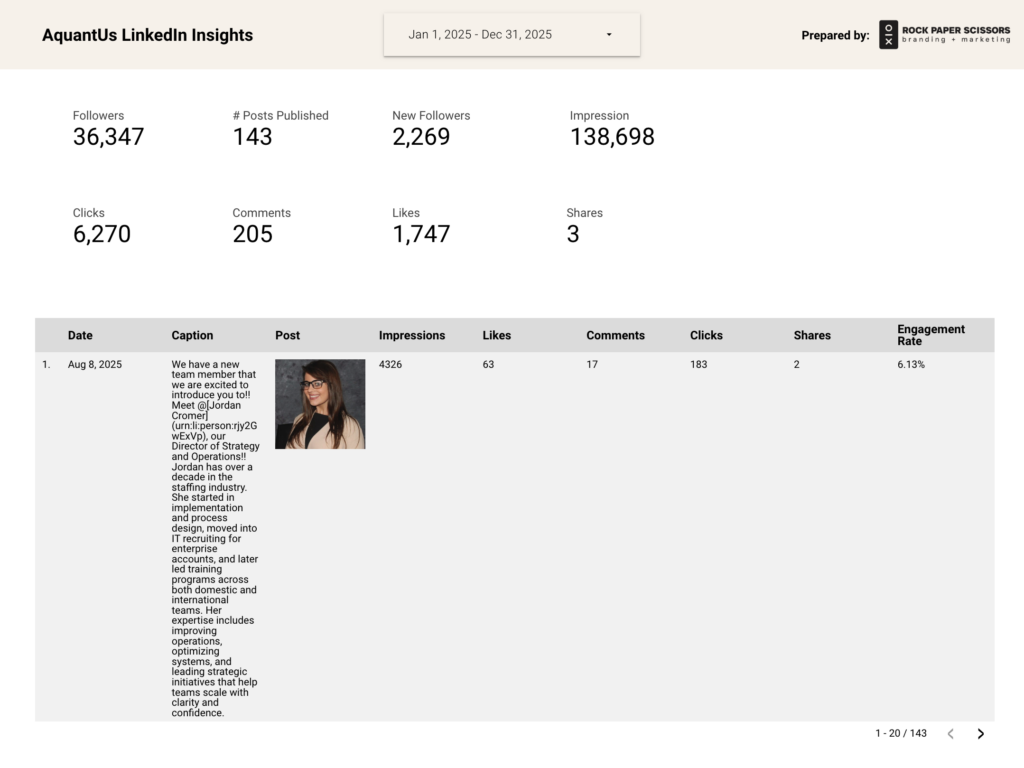
AquantUs – Atlanta Recruiting Firm (1 year of Looker Studio reporting for LinkedIn 2025 vs. 2024)
As a recruiting firm, LinkedIn is a large part of AquantUs’ communication strategy. We provided tailored recommendations each month based on metrics and post-performance in order to increase their visibility and engagement. Because AquantUs was able to shift their strategies based on our recommendations, after one year of monthly LinkedIn analysis, in 2025, they were able to see:
These gains translated into significantly higher visibility and stronger audience engagement across their network.
"Looker Studio serves up an easy-to-digest dashboard that provides me with a 'one-stop shop' for my KPIs and allows me to calculate ROI on our specific tools to determine what’s working, what’s not working, and what needs to be adjusted. The team at RPS does an exceptional job of helping me interpret the data and provides strategic and tactical recommendations on what we can adjust to ensure our marketing and social media efforts are yielding the results we desire."
Tiffany Hoffine, Managing Partner
Rainbow Village – Non-profit (6 months of Looker Studio reporting for Meta)
As a local non-profit, visibility on their community engagement is an important metric for this organization. After six months of consistent reporting, recommendation and strategic implementation, they were able to see a:
78% increase in Facebook post views
119% increase in Instagram views
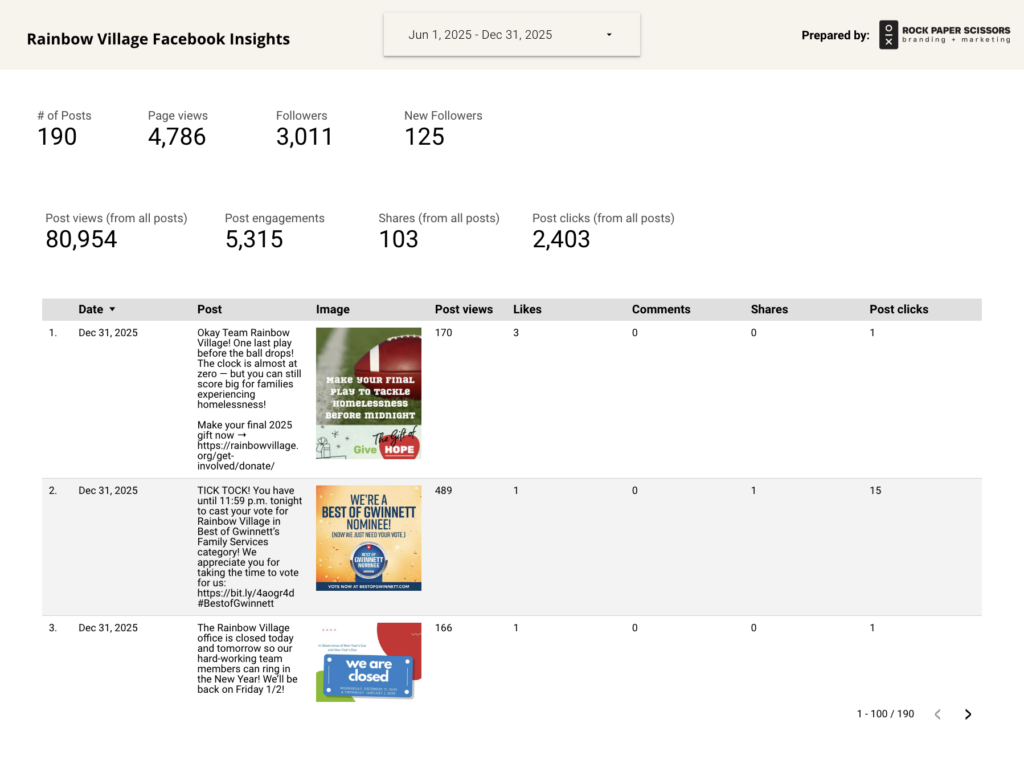
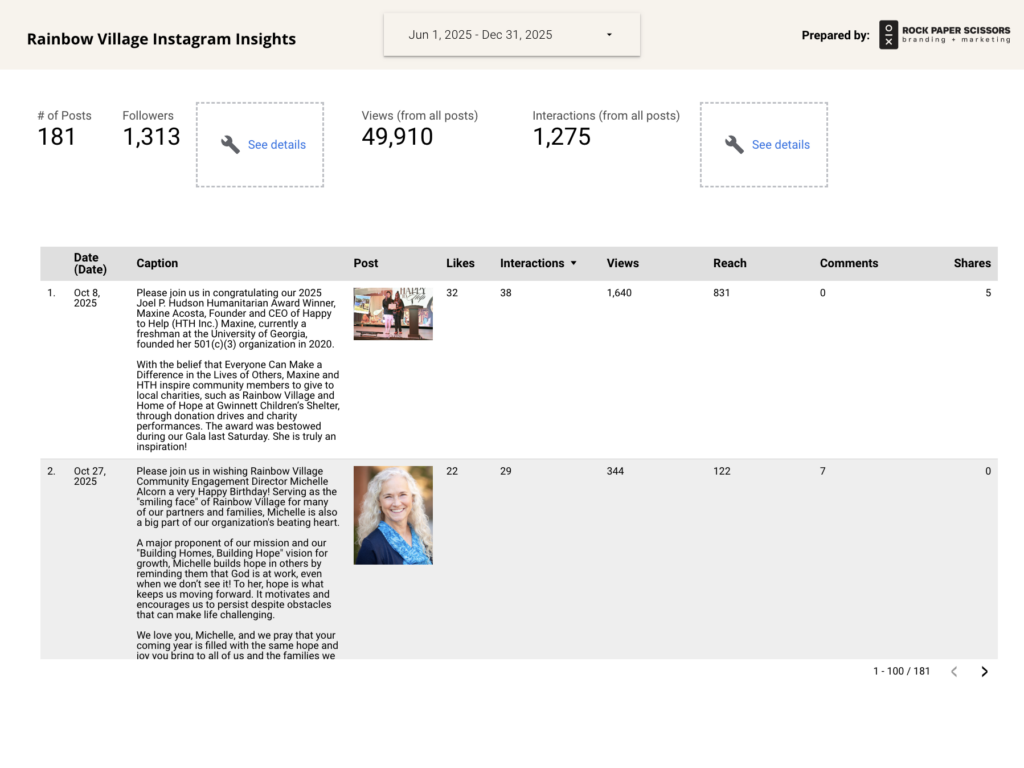
With clearer insights, they were able to refine their content and expand their reach within the community.
“The transition away from digging into each individual social platform has made it easier to view all of our social and website analytics in one centralized, easy-to-use dashboard.”
Brittany Lowe, Community Engagement Coordinator
Beyond performance gains, one of the most powerful outcomes of our Looker Studio dashboards is predictability. By tracking long-term trends and post-level performance, we’re able to identify when exceptional, one-off content, such as event promotions, major announcements or special celebrations, creates a temporary spike in metrics.
Instead of reacting when numbers naturally settle back into their normal range, our clients are prepared for it. We can flag these moments in advance, explain what’s driving the change and set realistic recommendations to maintain an increase in metrics. This level of insight turns reporting into a planning tool, not just a recap. Clients gain confidence knowing what’s normal, what’s exceptional and what truly signals a need for strategy shifts.
Rock Paper Scissors’ Looker Studio dashboards give clients the confidence to make informed decisions and clearly see their return on investment. Through monthly reporting and expert analysis, we’re able to recommend what’s working, identify what’s not and adjust strategies in real time. The result? Faster workflows, smarter conversations and marketing strategies driven by insight, not instinct. Our clients aren’t just looking at data anymore; they’re using it to grow.